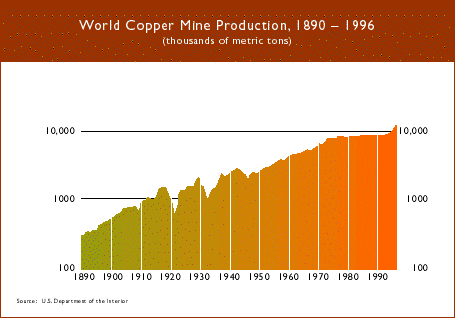
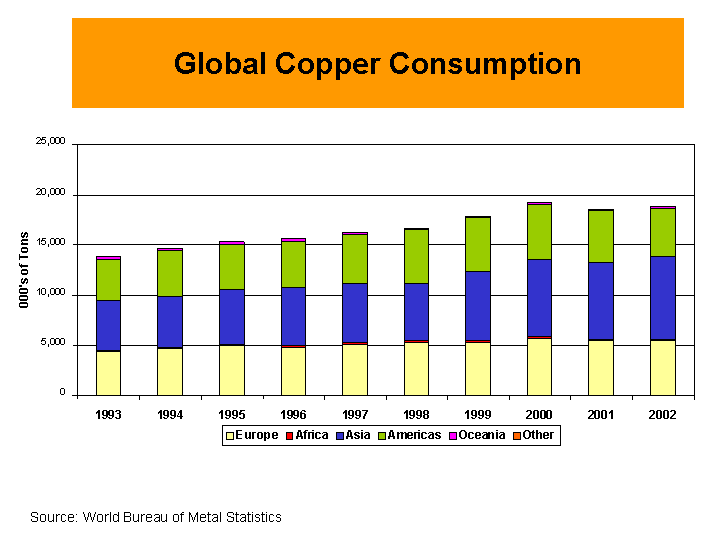
Despite all the bad news we are hearing about the economy, its interesting to reflect on commodity prices. Given the weak overtones, you might have been expected to see weakness in commodity prices. Well they have been surprisingly resilient. Copper has fallen to $US2.90/lb, but its back up over $3.00/lb. Zinc and lead are fairing even better.
I would like to think that its a sign of incredible resilience in the global economy, but I dont think so, or at least its not the whole story. I think its a shortage of metal, or more specifically delays and difficulties commissioning new mine capacity, combined with the odd strike, as mine workers attempt to benefit from some of the high metal prices. There is a huge shortage of semi-autogenous grinding (mills), tyres and a range of other consumables. Its evident that these shortages are delaying projects, and even hindering established projects. So whilst the global economy might we softening, there is little relief for commodity buyers. The reason I suspect this is the case is because metal stockpiles seem to be falling. Take a look at stockpiles at the LME and COMEX exchanges. Nickel is rising to medium term highs, but zinc stockpiles have been falling since Oct'07, lead stockpiles started falling this week, copper on the COMEX has falling stockpiles since Oct'07, and flat on the London Metals Exchange lately. Aluminium stockpiles have stabilised.
At the same time most of the commodity producing currencies have experienced something of a sell-off. eg. The AUD has fallen from 93c to 87c against the USD. So it all looks good for commodity producers. So I like Matrix Metals, given that its planning to expand output significantly.
 Global Mining Investing $69.95, 2 Volume e-Book Set. Buy here.
Author, Andrew Sheldon
Global Mining Investing is a reference eBook to teach investors how to think and act as investors with a underlying theme of managing risk. The book touches on a huge amount of content which heavily relies on knowledge that can only be obtained through experience...The text was engaging, as I knew the valuable outcome was to be a better thinker and investor.
While some books (such as Coulson’s An Insider’s Guide to the Mining Sector) focus on one particular commodity this book (Global Mining Investing) attempts (and does well) to cover all types of mining and commodities.
Global Mining Investing - see store
Tuesday, December 11, 2007

Monday, November 26, 2007
Gold consolidating
In the coming weeks I suspect gold will consolidate in USD terms, but expect the signs of a weaker global economy to feed into lower currencies for commodity producing currencies like the AUD, CAN, BZL, etc. The implication is that precious metal (gold, silver, platinum) prices will be strong in local currency terms. So I am expecting stronger gold stocks despite some consolidation in gold prices. I also this this week gold stocks will loose ground because of general weakness in the overall market.
In the chart below I am suggesting the gold price is in the formative stages of a 'flag structure', the implication of which is - when the wedge is closed, we are going to see a $80/oz increase in gold prices. For the unhedged gold producer, tha equates to around 10-20% increase in earnings. So I'm looking for $US940-950/oz gold price in the next 6 months, and likely $A1100-1150/oz in Australian dollar terms.

In the chart below I am suggesting the gold price is in the formative stages of a 'flag structure', the implication of which is - when the wedge is closed, we are going to see a $80/oz increase in gold prices. For the unhedged gold producer, tha equates to around 10-20% increase in earnings. So I'm looking for $US940-950/oz gold price in the next 6 months, and likely $A1100-1150/oz in Australian dollar terms.

Monday, November 12, 2007
Copper prices break support
Copper prices have fallen to $3.12/lb, breaking an important support at $3.20/lb. The positive news is that we have a Fed meeting on Thursday, and if there is a Fed rate cut, that might be enough to support the market. So we might see a recovery. Spot prices will under or overshoot, so it would be worth waiting for that confirmation of market direction.


Gold plummets 4.6% overnight
Last night we were reminded of the small size of the gold market is, as it was dumped by financial institutions. The gold price fell $US37/oz or 4.6% to $US792/oz, having just risen short of $US850/oz. I guess no one is more surprised than Frank McGhee, head precious metals trader at Integrated Brokerage Services in Chicago. He told Reuters "I would be very surprised to see it penetrate much below the $800 level". I am too Frank....I am too.
Technical Analysis

The reason why I am surprised is that tensions in the Middle East are still high, but then there are a number of negatives:
1. Carry trade being unwound by rising USD
2. The gold price was retracing from a major resistance of $US850
3. Gold is a very small market traded by institutions
4. Falling oil price - it fall $2.70/barrel overnight to $93.62. Not so significant.
5. The rise in gold price was quiet rapid so any retracement was going to be as well
But like Frank I was surprised that gold fell below $US800/oz, and I'd be surprised if it falls back further given the Iran situation. Mind you I dont see the Iran issue flaring beyond a few bunker-busting missile hits on nuclear installations in Iran. However the risk upside should lift gold. In the short term, maybe there wasn't enough concern there to lift gold, and it was just technical trading.
Looking at the charts its not so surprising that gold fell off from a major support, and perhaps its more the fact that equity markets were coming under pressure at the same time and were sold into to cover losses elsewhere. Market liquidation hurts all markets. For this reason, without any solid support for gold (Middle East tensions and an interest rate cut), I think gold will continue to fall as long as the larger equity markets are being sold. More importantly, the sell off may in fact be a symptom of forthcoming hedge fund losses. This is the biggest sell-off of precious metals since June 2006 when futures fell 7.6%.
At some point equity markets are going to price in some inflation into their earnings multiples (PERs). When this occurs we can expect a significant fall in equities and, and I think it will flow through to gold until that inflationary expctation becomes a market reality. At that point we will see a stellar performance from gold.
At some point equity markets are going to price in some inflation into their earnings multiples (PERs). When this occurs we can expect a significant fall in equities and, and I think it will flow through to gold until that inflationary expctation becomes a market reality. At that point we will see a stellar performance from gold.
Technical Analysis
The chart of the Dow Jones below shows that gold is close to the major 12800 point support that it fell to in Aug-07 sub-prime related sell-down. On Thursday we are due for another interest rate setting by the Federal Reserve. It seems more than likely that there will be another Fed cut at that meeting. This will prove negative for the USD, but you would think positive for gold and equity markets. It should keep the Dow above the 12800-point support a little longer. But after a big fall in gold, I dont see a rapid recovery in gold. More likely a more gradual decline to the major $740 support, then I think we are in for a more significant rally than the last.

In the chart below we can see that gold was sold off within a fraction of the $850/oz resistance reached in Jan 1980. That last red candle is an engulfing candle, suggesting that gold has parred back all the gains of the previous week, and is a sign of further weakness. I dont see any significant support until the $740/oz level, suggesting there are significant falls in gold coming. I think that support will prove to be a very solid one, and I dont see a fall to $US700/oz.

So we might be looking at a post-Xmas rally in gold stocks, but until then I suggest growth-related stocks look more promising as equity markets go for another rally. But at some point inflation and risk premiums will be priced into markets.
Wednesday, November 07, 2007
Gold vulnerable for short term sell off
Gold has rallied to $845/oz overnight, but was sold back to $833/oz. This of course reflects the fact that gold is a relatively small market, and for that reason institutions were short-term selling before gold reached the $850/oz peak (resistance) reached in Jan 1980.
Well of late I lost a HDD due to a computer virus, so I've not made posts, but just to backtrack a bit. Gold is going to offer a stella performance for several reasons:
1. Strong Rand - South Africa produces most of the world's gold. the problem is, as gold prices go up, so does the Rand, and significantly so because of the huge reliance they have on precious metals (gold & platinoid metals).
2. Subdued growth in gold
3. Growing inflationary expectations - there is a fallacy that you can avoid inflation by suppressing demand. This is nonsense. Inflation is a monetary phenomena, not a demand issue.
4. Tensions in the Middle East - Iran will push the US to military action then back down
5. Outlook of low yields - real interest rates since we have a Fed cutting rates when inflation is stronger
It never ceases to amaze me the lack of appreciation people have for the speculative demand for gold. They look at Indian jewellery demand and think its significant. Basically what drives the gold market is speculation - at least in the times when it warants interest. Of course if there is no monetary concern, then gold is subdued. In those instances it trades as a 'physical commodity'. But when the value of money is being eroded or the asset bubble is in question, people and institutions flock to gold....a market the size of 2 Microsoft's. Its minute compared to the markets from which people are divesting, giving gold alot of upside. So though gold was sold off, dont expect it to stop. I suspect even gold shares might be bouyed by the outlook despite the late sell-off.

Finally a comment about Iran.
The reason that the Iran situation is good for gold is because there are signs that Iran is escalating the conflict over nuclear weapons. Ali Larijani, the chief negotiator for Iran's nuclear project, has resigned after 2 years. Larijani was a close friend of Ali Khamenei, the supreme leader of Iran, though he appears to be at odds with the ayatollah and President Mahmoud Ahmadinejad. I think these 2 idiots are hoping to milk the US conflict for all they can get. Think about it – they are oil exporters and they probably have a stock of gold. President Ahmadinejad is very unpopular on economic policy, so clearly he has learned from the Bush-Blair-Howard team on how to win votes. President Ahmadinejad displaced the reform-minded candidate in the 2005 election. Polls suggest Ahmadinejad has lost half his support base. The president's term ends in 2009.
The replacement as chief of the National Security Council is Saeed Jalili, who supports the president. Interesting 183 of the 290 member parliament praised Larijani, suggesting most of the parliament is against this policy.
The president's term ends in 2009. Perhaps they hope to get greater concessions by pushing the US to war, as well as gaining more support in Iran (‘read anti-US sentiment’), or are they trying to ensure the president is replaced by another hardliner? I think they will continue to push until the US does drop bombs because they want to fuel US resentment. A few Iran lives means nothing to them.
Well of late I lost a HDD due to a computer virus, so I've not made posts, but just to backtrack a bit. Gold is going to offer a stella performance for several reasons:
1. Strong Rand - South Africa produces most of the world's gold. the problem is, as gold prices go up, so does the Rand, and significantly so because of the huge reliance they have on precious metals (gold & platinoid metals).
2. Subdued growth in gold
3. Growing inflationary expectations - there is a fallacy that you can avoid inflation by suppressing demand. This is nonsense. Inflation is a monetary phenomena, not a demand issue.
4. Tensions in the Middle East - Iran will push the US to military action then back down
5. Outlook of low yields - real interest rates since we have a Fed cutting rates when inflation is stronger
It never ceases to amaze me the lack of appreciation people have for the speculative demand for gold. They look at Indian jewellery demand and think its significant. Basically what drives the gold market is speculation - at least in the times when it warants interest. Of course if there is no monetary concern, then gold is subdued. In those instances it trades as a 'physical commodity'. But when the value of money is being eroded or the asset bubble is in question, people and institutions flock to gold....a market the size of 2 Microsoft's. Its minute compared to the markets from which people are divesting, giving gold alot of upside. So though gold was sold off, dont expect it to stop. I suspect even gold shares might be bouyed by the outlook despite the late sell-off.

Finally a comment about Iran.
The reason that the Iran situation is good for gold is because there are signs that Iran is escalating the conflict over nuclear weapons. Ali Larijani, the chief negotiator for Iran's nuclear project, has resigned after 2 years. Larijani was a close friend of Ali Khamenei, the supreme leader of Iran, though he appears to be at odds with the ayatollah and President Mahmoud Ahmadinejad. I think these 2 idiots are hoping to milk the US conflict for all they can get. Think about it – they are oil exporters and they probably have a stock of gold. President Ahmadinejad is very unpopular on economic policy, so clearly he has learned from the Bush-Blair-Howard team on how to win votes. President Ahmadinejad displaced the reform-minded candidate in the 2005 election. Polls suggest Ahmadinejad has lost half his support base. The president's term ends in 2009.
The replacement as chief of the National Security Council is Saeed Jalili, who supports the president. Interesting 183 of the 290 member parliament praised Larijani, suggesting most of the parliament is against this policy.
The president's term ends in 2009. Perhaps they hope to get greater concessions by pushing the US to war, as well as gaining more support in Iran (‘read anti-US sentiment’), or are they trying to ensure the president is replaced by another hardliner? I think they will continue to push until the US does drop bombs because they want to fuel US resentment. A few Iran lives means nothing to them.
Saturday, September 29, 2007
Opportune time for agricultural commodities
Anyone interested in agricultural commodities should check out my latest post on my forex blog. Its particularly pertinent to NZ and Australia. See http://forextraneous.blogspot.com/2007/09/dont-ride-off-nz-economy.html.
Friday, September 28, 2007
Gold breaking out! Confirmed
Friday's trading in NY gave us clear confirmation that the price of gold is just about to rally. The gold price closed at $US743.70/oz, the highest level in 27 years (since Jan 1980). And if you think thats significant consider that inflation over the last 27 years is likely to have discounted the gold price by 60% by the distorted CPI measure , and probably 120% in real terms. You would need to look to see how the money supply has expanded over that time.
The break is convincing in several respects:
1. Gold broke the previous high of $730.30 set on the 8th May'06.
2. The gold price rally was convincing in itself - up $9.75/oz
3. The gold price closed near its daily high
4. The gold price move is supported by strong fundamentals

But if we look at the following chart we can see that the current rally in the gold price is partially due to gold fundamentals (in as much as the gold price is rising in terms of all currencies) and partly due to a weaker USD (in as much as the USD denominated gold price has risen more). Of course what we would like to see is the gold price break out in Euro & Pound terms, as well as Yen and AUD.

A real increase in the gold price in terms of multiple currencies communicates a growing distrust of monetary units. The reason for this distrust is the relative decline in the valu of those currencies. Currencies decline in value in real terms because the amount of currency in circulation is growing faster than the productive capacity of the global economy. You might think this is a signal to buy other tangible or physical assets as well, but actually this is not the case because their prices are already too high. Most asset markets are high priced because in a period of prolonged monetary expansion, those assets become priced (not on the basis of cost + profit margin) but your ability to pay and your belief in the sustainability of those high prices. The consequence is thus, asset prices are too high, and they will only offer gold buying when interest rates have risen to an extent that property holdings have been deleveraged. You might ask what level of deleveraging has to occur. Well that depends on each country's monetary expansion over the last 20 years less the amount of productive capacity added. Those countries like Australia which have huge exposure to metals are more vulnerable, even though they are helped by gold mining capacity.
You might ask 'why gold' since it is an asset? Well the reason is that gold has under-performed as an asset class over the last 5 years compared to other assets. The reason that it has under-performed is because it offers a low return - assuming you lease the metal, and none if you dont. Its this criticism of gold that makes it the most attractive investment, along with other precious metals. But gold is the best at this stage of the cycle because other precious metals will suffer eventually from a 'demand shock' as higher interest rates curtail industrial demand for commodities.
But gold is a financial asset as well, and as such, its possible for companies to leverage themselves into gold, so prices will in times of uncertainty be volatile. Financial intermediaries will be inclined to sell gold to cover other loss-making positions. But gold will recover like no other financial instrument - at least until the market is deleveraged. In times of instability markets tend to over-react.
Over the last 20 years western governments have been competing in a money expansion fest. Rising inflation will undermine that. Governments can conceal inflation, but they can't conceal the financial burden that places on 'real' people, so there will be a backlash. Higher gold prices will raise attention to this fact. Why is gold over $400/oz if not inflation? Afterall it offers bugger all return. The reason is - its real money when fiat paper is not trusted. The other sign of high inflation is wages...and with falling housing prices, reseting interest rates, tight labour markets, we can expect higher rates.
The break is convincing in several respects:
1. Gold broke the previous high of $730.30 set on the 8th May'06.
2. The gold price rally was convincing in itself - up $9.75/oz
3. The gold price closed near its daily high
4. The gold price move is supported by strong fundamentals

But if we look at the following chart we can see that the current rally in the gold price is partially due to gold fundamentals (in as much as the gold price is rising in terms of all currencies) and partly due to a weaker USD (in as much as the USD denominated gold price has risen more). Of course what we would like to see is the gold price break out in Euro & Pound terms, as well as Yen and AUD.

A real increase in the gold price in terms of multiple currencies communicates a growing distrust of monetary units. The reason for this distrust is the relative decline in the valu of those currencies. Currencies decline in value in real terms because the amount of currency in circulation is growing faster than the productive capacity of the global economy. You might think this is a signal to buy other tangible or physical assets as well, but actually this is not the case because their prices are already too high. Most asset markets are high priced because in a period of prolonged monetary expansion, those assets become priced (not on the basis of cost + profit margin) but your ability to pay and your belief in the sustainability of those high prices. The consequence is thus, asset prices are too high, and they will only offer gold buying when interest rates have risen to an extent that property holdings have been deleveraged. You might ask what level of deleveraging has to occur. Well that depends on each country's monetary expansion over the last 20 years less the amount of productive capacity added. Those countries like Australia which have huge exposure to metals are more vulnerable, even though they are helped by gold mining capacity.
You might ask 'why gold' since it is an asset? Well the reason is that gold has under-performed as an asset class over the last 5 years compared to other assets. The reason that it has under-performed is because it offers a low return - assuming you lease the metal, and none if you dont. Its this criticism of gold that makes it the most attractive investment, along with other precious metals. But gold is the best at this stage of the cycle because other precious metals will suffer eventually from a 'demand shock' as higher interest rates curtail industrial demand for commodities.
But gold is a financial asset as well, and as such, its possible for companies to leverage themselves into gold, so prices will in times of uncertainty be volatile. Financial intermediaries will be inclined to sell gold to cover other loss-making positions. But gold will recover like no other financial instrument - at least until the market is deleveraged. In times of instability markets tend to over-react.
Over the last 20 years western governments have been competing in a money expansion fest. Rising inflation will undermine that. Governments can conceal inflation, but they can't conceal the financial burden that places on 'real' people, so there will be a backlash. Higher gold prices will raise attention to this fact. Why is gold over $400/oz if not inflation? Afterall it offers bugger all return. The reason is - its real money when fiat paper is not trusted. The other sign of high inflation is wages...and with falling housing prices, reseting interest rates, tight labour markets, we can expect higher rates.
Wednesday, September 26, 2007
Source of Base Metal Charts
Until about 12 months ago you could download daily price and stocks data for base metals. Sadly the LME has gone commercial and you now have to pay for it through one of their intermediaries. Fortunately Kitco and others offer daily prices and historical charts which effectively does the job for you. I would however argue that the charts are not as accurate as the trading platform charts.
The historical charts can be accessed at:
1. Copper: See www.kitcometals.com/charts/copper_historical.html
2. Zinc: See www.kitcometals.com/charts/zinc_historical.html
3. Nickel: www.kitcometals.com/charts/nickel_historical.html
4. Lead: www.kitcometals.com/charts/lead_historical.html
5. Aluminium: See www.kitcometals.com/charts/aluminum_historical.html
6. Tin: See ???
In the precious metals we have
7. Gold: See www.kitco.com/charts/techcharts_gold.html
8. Silver: See www.kitco.com/charts/techcharts_silver.html
9. Palladium: See www.kitco.com/charts/techcharts_palladium.html
10. Platinum: See www.kitco.com/charts/techcharts_platinum.html
11. Rhodium: See www.kitco.com/charts/historicalrhodium.html
These are the traded metals where there is a high level of price discovery or disclosure. There are of course alot of other where price information is not so transparent because these metals prices are concealed by confidential commercial agreements between producers and end users. The reason for this is that these markets are illiquid. Another problem is that the metals are often sold as ores or metal concentrates with widely variable concentrations, as well as price bonuses (for precious by-products) and penalties (for deleterious contaminants). For this reason its difficult to reach a standard price for these commodities because every refinery has a different pricing policy to achieve competitive advantage. These metals include:
12. Zircon:
13: Niobium:
14. Tantalum: See www.metalprices.com/FreeSite/Charts/tantalite_charts.html?weight=lb (before 2006) and http://metalsplace.com/prices/?a=14&grt=6 since.
15. Molybdenum: See www.adanacmoly.com/adanac_stock.php
16. Manganese: See www.metalprices.com/FreeSite/Charts/mn_ferro_charts.html?weight=lb (before 2006)
17. Cobalt: See ??
18. Magnesium: See http://metalsplace.com/prices/
19. Chrome: See ??
20. Antimony: See ??
21: Bismuth: See ??
22. Tungsten: See http://metalsplace.com/prices/?a=4&grt=5
23. Mercury: See ??
24. Vanadium: See ??
25. Cadmium: see www.asianmetal.com/Metal_News/index_product63_en.asp or http://metalsplace.com/prices/?a=15&grt=6
26. Iron ore: See http://metalsplace.com/prices/
No other metal not listed here is sold as a discrete commodity because they dont occur in isolation. Even some of the commodities above are seldom mined as a discrete commodity. eg. Cobalt is usually a by-product of nickel mining, bismuth is often a by-product of tin mining, antimony is often associated with gold. These metal combinations might simply be liberated by physical crushing, but often they require more expensive chemical separation processes that directly impact on the value of ores, thus making price determination less transparent.
Finally we have the energy-based commodities:
25. Petroleum:
26. Natural Gas:
27. Uranium (yellowcake): See www.uxc.com/review/uxc_g_price.html or in constant dollar terms www.uxc.com/review/uxc_g_hist-price.html
28. Thorium: See http://minerals.usgs.gov/minerals/pubs/metal_prices/
Otherwise you can perform price queries at this site: www.metalprices.com/freesite/historical/price-query.asp. See the US Geological Survey for more more info on commodities: http://minerals.usgs.gov/minerals/pubs/metal_prices and www.crbtrader.com/fund/articles/default.asp. Here are a few other places for metal price charts - http://www.mineralstox.com/.
The historical charts can be accessed at:
1. Copper: See www.kitcometals.com/charts/copper_historical.html
2. Zinc: See www.kitcometals.com/charts/zinc_historical.html
3. Nickel: www.kitcometals.com/charts/nickel_historical.html
4. Lead: www.kitcometals.com/charts/lead_historical.html
5. Aluminium: See www.kitcometals.com/charts/aluminum_historical.html
6. Tin: See ???
In the precious metals we have
7. Gold: See www.kitco.com/charts/techcharts_gold.html
8. Silver: See www.kitco.com/charts/techcharts_silver.html
9. Palladium: See www.kitco.com/charts/techcharts_palladium.html
10. Platinum: See www.kitco.com/charts/techcharts_platinum.html
11. Rhodium: See www.kitco.com/charts/historicalrhodium.html
These are the traded metals where there is a high level of price discovery or disclosure. There are of course alot of other where price information is not so transparent because these metals prices are concealed by confidential commercial agreements between producers and end users. The reason for this is that these markets are illiquid. Another problem is that the metals are often sold as ores or metal concentrates with widely variable concentrations, as well as price bonuses (for precious by-products) and penalties (for deleterious contaminants). For this reason its difficult to reach a standard price for these commodities because every refinery has a different pricing policy to achieve competitive advantage. These metals include:
12. Zircon:
13: Niobium:
14. Tantalum: See www.metalprices.com/FreeSite/Charts/tantalite_charts.html?weight=lb (before 2006) and http://metalsplace.com/prices/?a=14&grt=6 since.
15. Molybdenum: See www.adanacmoly.com/adanac_stock.php
16. Manganese: See www.metalprices.com/FreeSite/Charts/mn_ferro_charts.html?weight=lb (before 2006)
17. Cobalt: See ??
18. Magnesium: See http://metalsplace.com/prices/
19. Chrome: See ??
20. Antimony: See ??
21: Bismuth: See ??
22. Tungsten: See http://metalsplace.com/prices/?a=4&grt=5
23. Mercury: See ??
24. Vanadium: See ??
25. Cadmium: see www.asianmetal.com/Metal_News/index_product63_en.asp or http://metalsplace.com/prices/?a=15&grt=6
26. Iron ore: See http://metalsplace.com/prices/
No other metal not listed here is sold as a discrete commodity because they dont occur in isolation. Even some of the commodities above are seldom mined as a discrete commodity. eg. Cobalt is usually a by-product of nickel mining, bismuth is often a by-product of tin mining, antimony is often associated with gold. These metal combinations might simply be liberated by physical crushing, but often they require more expensive chemical separation processes that directly impact on the value of ores, thus making price determination less transparent.
Finally we have the energy-based commodities:
25. Petroleum:
26. Natural Gas:
27. Uranium (yellowcake): See www.uxc.com/review/uxc_g_price.html or in constant dollar terms www.uxc.com/review/uxc_g_hist-price.html
28. Thorium: See http://minerals.usgs.gov/minerals/pubs/metal_prices/
Otherwise you can perform price queries at this site: www.metalprices.com/freesite/historical/price-query.asp. See the US Geological Survey for more more info on commodities: http://minerals.usgs.gov/minerals/pubs/metal_prices and www.crbtrader.com/fund/articles/default.asp. Here are a few other places for metal price charts - http://www.mineralstox.com/.
Friday, September 21, 2007
Gold testing resistance at $US730/oz
The gold price has rallied up to the $US730/oz resistance as expected. This is the last hurdle before we see alot of upside. Given the speed of the rally it would not surprise me to see gold fall back to $694-700/oz level. This was previous resistance and would make a strong support. But by no means is the gold bull over. In fact it would not surprise me if gold rallied on from here. As always - its prudent to look to the charts for guidance at this critical junctures - at least for market entry and exit.


So as we can see from the chart, gold is currently at $733/oz. Thats its previous high set back in May-07. Lets see what the market action shows over Monday and Tuesday. I'm could go higher because it closed the week off a high point. But there is the possibility of a stronger USD if the European Central Bank shows an indication that it wil also lower interest rates. Since central banks are mandated to set policy rates that will sustain economic growth, you can bet that they will making early statements to prevent the Euro from trading too high. So that might be a short term factor driving gold down in the short term. But thats merely a USD-denomination issue - weaker nominal rates and higher 'real' inflation (not the CPI nonsense figures) highlight the fundamental upside for gold.
Thursday, September 06, 2007
Gold breaking out!
In recent weeks I have displayed some caution with respect to gold in the short to medium term fearing a sell-off in gold along with other markets, notwithstanding the long term positive outlook for gold. I misread the 'fundamentals' and thus I now find myself fully committing to the market. Whereas yesterday I was only 30% invested, today I am fully invested in gold-copper stocks - with a focus on unhedged producers. The commitment comes with alot of confidence, because not only has the gold price broken out on the upside of a wedge, it has moved up some $12/oz to test a previous high set in Mar'07. The gold price has however not yet broken that resistance, so we will be looking for the market to confirm the break-out with a higher gold price in New York and London later today. If this resistance at $694/oz is convincingly broken, then we are looking at a new target of $720-730/oz in the short term, and far higher in the long term.
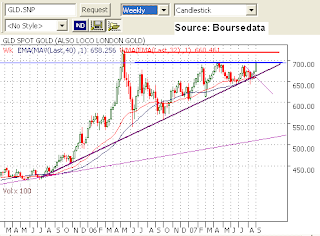
The rationale for not yet investing in gold (stocks) was that I perceived a possibility of short term weakness in gold as a result of investment fund selling, as they raced to cover positions, so wanted to wait mostly on the sides until the confirmation came today. Clearly the market believes the US government and Fed are going to support the credit market, or that it will otherwise save itself. Regardless I will support the trend as long as it persists. See A Speculators Dream to see which ASX stocks I'm holding.

The rationale for not yet investing in gold (stocks) was that I perceived a possibility of short term weakness in gold as a result of investment fund selling, as they raced to cover positions, so wanted to wait mostly on the sides until the confirmation came today. Clearly the market believes the US government and Fed are going to support the credit market, or that it will otherwise save itself. Regardless I will support the trend as long as it persists. See A Speculators Dream to see which ASX stocks I'm holding.
Sunday, September 02, 2007
Gold - Trend confirmation imminent
We are very close to having our trend confirmed in the gold market. Gold was on the cusp of a trend change on Friday until the Bernacke-Bush duo conspired to sing the same happy song, but look at what they are offering:
1. Bush is offering creditors support if they have a good credit history - to his credit its better targeted support than the central bank flooding the banking system with liquidity
2. Bernacke providing the market with at least the 'hope' of a rate cut. Its my personal opinion that if he was going to offer a rate cut - it would have come 2 weeks ago.
So the choir singing was a surprise - but it comes no surprise that the performance was out of tune. Am I starting to sound like a nervous central banker. Well, just to offer some technical support to this premise:
1. The gold market rallied $8/oz on the news of the Bush-Bernacke support
2. Bush at least seems to be conveying the message that the US government and Fed are on the same ball team by speaking on the same day (Friday)
The bad news for markets:
1. The Dow has not broken resistance - see Market Commentary
2. The gold price has not broken its previous high. Instead it was sold off from $675/oz to $672.
So I think its premature to take a position in the precious metals market or stocks. At this point I see all markets being sold off - but the precious metals market will eventually shine.
1. Bush is offering creditors support if they have a good credit history - to his credit its better targeted support than the central bank flooding the banking system with liquidity
2. Bernacke providing the market with at least the 'hope' of a rate cut. Its my personal opinion that if he was going to offer a rate cut - it would have come 2 weeks ago.
So the choir singing was a surprise - but it comes no surprise that the performance was out of tune. Am I starting to sound like a nervous central banker. Well, just to offer some technical support to this premise:
1. The gold market rallied $8/oz on the news of the Bush-Bernacke support
2. Bush at least seems to be conveying the message that the US government and Fed are on the same ball team by speaking on the same day (Friday)
The bad news for markets:
1. The Dow has not broken resistance - see Market Commentary
2. The gold price has not broken its previous high. Instead it was sold off from $675/oz to $672.
So I think its premature to take a position in the precious metals market or stocks. At this point I see all markets being sold off - but the precious metals market will eventually shine.
Thursday, August 23, 2007
Gold Outlook - gloomy?
The gold market has been disappointing a few people of late. In the midst of a meltdown of equities - a 10% fall - the gold price was pretty subdued, in fact it fell on several occasions, but recovered. Clearly those seeing gold as a 'safe haven' were matched by those needing to sell 'safe gold' to cover margin calls on their equity and other commodity exposures.
Well thats all well and fine, but what is the outlook for gold now?
Gold Fundamental Analysis
What we know about gold is that its:
What we know about gold is that its:
1. Relatively cheap: Attractive when other asset classes are over-priced and central banks feel compelled to support those asset prices with easy money
2. Negative real yields: Gold is attractive when nominal yields on treasuries are low because inflation they are likely to be negative. So if gold lease rates are low and gold prices are considered low, then the metal is likely to be supported.
3. Uncertainty: Gold is attractive if there is a threat of war, whether on the battlefield or trade tensions. The rationale is that asset prices are supported by consumption and during wars capacity is directed from productive to destruction capacity, so paper money or higher taxation is required. Gold is taxed only at the point of production or sale (if profit), and even then there is the potential for unrecorded production or sale.
There are numerous misconceptions about gold that are supported by 'gold cynics', 'gold bugs' and gold producers alike. Really these arguments are often rationalisations by 'purists' that carry weight with the uninformed by virtue because their arguments are supported by alot of information. Some of these arguments are:
1. Gold is no longer relevant: Since gold's role as a unit of money was partially replaced by fiat paper money in 1933 (under Roosevelt), and then totally in 1971 (under Nixon) it never really lost its relevance. This point should be highlighted by the current price of the gold - around $655/oz.
2. Paper is not backed by gold: Well this is true, but it would be wrong to suggest that paper has no tangible assets backing , since under the modern banking system paper is created through the origination of credit, and that credit is backed by very tangible property. Home loans at the point of origination are backed by tangible collateral valued at 80-90% of the loan amount. Ever wondered why banks are reluctant lenders to business without tangible assets or regular income. The gold standard 'purists' would have us believe that they believe in a 'free market' but they were advocates of fixed price of gold, as when gold was fixed at $35/oz (pre-1971). But clearly that system didnt work since it required governments to subsidise its value. It actually makes more sense for the gold price to be free floating so gold is valued on the basis of supply and demand. Rest assured that there will not be too much volatility because the value of new gold output (2500tonnes) per annum is just 1.7% of the total above-ground supplies (150,000 tonnes). The implication is that gold would fall in value as mine costs fall but this would increase the purchasing power of all the existing gold in existence. This would be the productivity dividend. No other metal offers this benefit because other metals have a much larger proportion of their utility tied to industrial use.
2. Paper is not backed by gold: Well this is true, but it would be wrong to suggest that paper has no tangible assets backing , since under the modern banking system paper is created through the origination of credit, and that credit is backed by very tangible property. Home loans at the point of origination are backed by tangible collateral valued at 80-90% of the loan amount. Ever wondered why banks are reluctant lenders to business without tangible assets or regular income. The gold standard 'purists' would have us believe that they believe in a 'free market' but they were advocates of fixed price of gold, as when gold was fixed at $35/oz (pre-1971). But clearly that system didnt work since it required governments to subsidise its value. It actually makes more sense for the gold price to be free floating so gold is valued on the basis of supply and demand. Rest assured that there will not be too much volatility because the value of new gold output (2500tonnes) per annum is just 1.7% of the total above-ground supplies (150,000 tonnes). The implication is that gold would fall in value as mine costs fall but this would increase the purchasing power of all the existing gold in existence. This would be the productivity dividend. No other metal offers this benefit because other metals have a much larger proportion of their utility tied to industrial use.
3. Speculation is attributed to an excess of fiat paper: Whilst its true that fiat money does spark speculation, so does rampant wealth creation. When the global economy is growing at a pace that causes a rapid increase in incomes and falling interest rates, its understandable that people will be bidding up property prices. There is an expectation that they will miss out since people realise that the bull market will be sustained over a long period of time. The speculation arises merely because there is an expectation of a protracted increase in property prices, or equities. For this reason, weakness in equity prices are perceived as an opportunity to buy more rather than sell so long as the market supports credit creation. In western markets there is however another factor. The regulation of property markets through zoning regulations artificially raises the value of property.
Given these factors I would contend that gold is rising not because of fears of a financial crisis but because wealthy is growing whilst gold production is lagging in a number of countries. That means there are more buyers chasing less gold.
Gold Technical Analysis
In the chart below we can see that gold prices have been range-bound since Feb'07 between $640-690/oz. Currently gold is in a downtrend, and I expect it to fall back to $640/oz support. This view is supported by recent candles that show gold's failure to break the downtrend. Each rally is sold into. The good news is that gold was supported in the recent sell-down (10% equity market correction), but it remains in question whether the uptrend is supported. If this uptrend is broken, gold could move into a consolidation pattern or fall back to a lower support. Gold investors should sell gold if it fails to hold that uptrend line. Commonly when a trend is broken, it might recover to the trend, but then fall off thereafter..so the next week will be very important for gold.

Looking at the long term trend in gold in the chart below we can see that the current trend has been in place since July 2005. We can also see the historical importance of the $640 level. If that fails to hold, I think we are looking at a gold price of $US540/oz - upon which I expect support at gold's base line trend.

Conclusion

Looking at the long term trend in gold in the chart below we can see that the current trend has been in place since July 2005. We can also see the historical importance of the $640 level. If that fails to hold, I think we are looking at a gold price of $US540/oz - upon which I expect support at gold's base line trend.

Conclusion
My rationale for thinking gold might fall to this level is:
1. Strong global growth: The global economy is no lower US-centric since China and India are growing 3times the pace of the US. Whilst US GDP per capita might be 20x more than these countries, these 2 countries combined have 10x the population and increasingly they are contributing to global output.
2. Growth displaces yield: If global growth stays strong you can expect equities to be the focus and for weakness in bonds. There is the prospect that the Fed might provide the stimulus of lower interest rates to keep equities in play. I think the stimulus is likely to be a token 0.25% cut, and I think they will take it back when the market can hold it. I dont believe the Fed wants asset prices going any higher. I think they will be trying to keep then flat. The Fed will still be worried about inflation.
1. Strong global growth: The global economy is no lower US-centric since China and India are growing 3times the pace of the US. Whilst US GDP per capita might be 20x more than these countries, these 2 countries combined have 10x the population and increasingly they are contributing to global output.
2. Growth displaces yield: If global growth stays strong you can expect equities to be the focus and for weakness in bonds. There is the prospect that the Fed might provide the stimulus of lower interest rates to keep equities in play. I think the stimulus is likely to be a token 0.25% cut, and I think they will take it back when the market can hold it. I dont believe the Fed wants asset prices going any higher. I think they will be trying to keep then flat. The Fed will still be worried about inflation.
Anyway we will know very soon...
Wednesday, August 22, 2007
Base Metals - due for a shake out?
The base metals like Copper, Aluminium, Zinc and Lead seem to be holding up very well considering the uncertainties in the market. In contrast nickel is faring far worse, but it has likely bottomed. Paradoxically nickel miners are recording strong prices. There are I guess a number of reasons for this:


1. Strong demand from China
2. A market view that the Fed will support the market with a rate cut
3. Tight supplies for some metals

Having said that, the fundamentals dont look so good for some metals, and some charts might give reason for concern. The chart above shows that copper prices have retreated from a strong resistance level. My belief is that copper is headed down to $US2.50/lb, but it will then find support. Long term I think the outlook is positive, and we are likely to see an ascending triangle develop in coming years....a protracted period of high prices. I think things will be ok in the short term because it takes time for bad loans to be liquidated, and in the meantime there are strikes and the prospect of a Fed stimulus. But I really dont see higher copper prices in the medium term.
1.Copper prices have been held up by strikes in Chile and Mexico
2. We have yet to see any flow through of softer demand from China
3. There is a shortage of lead and aluminium because of a lack of discoveries. Stocks are thus short and prices bouyant.

But there has been alot of nickel capacity added so nickel prices have collapsed. But we might expect a turnaround there, so for the next 2-3weeks I expect stronger metal prices, but then massive selling.
Precious Metal Outlook
The market has been abuzz with conflicting advice on the direction of precious metals. Some argue that the precious metals have already gone up, inflated by the same credit bubble that pushed up other commodities, whilst others argue gold and silver have been a laggard until now because of strong global strong, and that gold and silver will rally because the Fed will lower short term interest rates to stabilise asset (property & equity) values.
There are a number of issues here that make me reflect:
1. The Fed has for a long time cared little about asset prices - that was on the upside, not the downside. And its long held mantra was that it would do what it takes to preserve growth. It seems unlikely that the Fed will engage in any monetary stimulus, but rather it is more likely to engage in short term stimulus to stabilise the markets. I think the Fed is aiming for an orderly unwinding of bad credit. The problem is, I think markets, looking for performance will not be impressed by the 'low growth' scenario, so I think they will sell off equities, and I think property will follow it.

3. Silver prices: I would have thought silver prices would exhibit a close correlation to the gold price, though perhaps silver has lost some of its monetary charm, and is weak because of the weaker outlook for silver industrial consumption, given that a much higher proportion of silver than gold is used by industry. The silver chart looks seriously bad, so I suspect its about to fall back to $8/oz and consolidate around $9/oz.

In conclusion I dont think the Fed would mind a fall off in asset prices just as it has not been too concerned about a rise in asset markets. I just think it wants to ensure a smooth fall so that people can sell out or go broke 'silently', so that consumer demand is not hindered. I think the Fed will fail on this point. I dont think the Fed will lower short term rates in Sept'07, or if they do, they lower it by 0.25% instead of 0.5%. I think they of course want the market to believe they will support the market with an interest rate cut, but I think instead their intent will just be to allow the uncertainty to wash out of the market. I think the other reason for weaker precious metal prices will be a shake out in base metal markets. I can see volatility on the LME and Comex exchange, where funds will be liquidating gold to pay margin calls on other metals, and otherwise just liquidating.
The good news is that gold and silver will recover, but it will present a good buying opportunity. Months ago there was alot of talk about a shake out in the commodity markets, but that fear seems to have been overshadowed by the 'sub-prime scandal'. I think commodity price collapse might be about to occur. So you'd thus have to expct some volatility in the $AUD, $CAN, RSA particularly, but it will be short term price action for gold and silver.
There are a number of issues here that make me reflect:
1. The Fed has for a long time cared little about asset prices - that was on the upside, not the downside. And its long held mantra was that it would do what it takes to preserve growth. It seems unlikely that the Fed will engage in any monetary stimulus, but rather it is more likely to engage in short term stimulus to stabilise the markets. I think the Fed is aiming for an orderly unwinding of bad credit. The problem is, I think markets, looking for performance will not be impressed by the 'low growth' scenario, so I think they will sell off equities, and I think property will follow it.
2. Gold prices: Based on the chart below, gold does not look too bad. It seems to be following its upward course, but what's got my attention is the selling off, evidenced by a string of 'engulfing candles'. Short term profit taking? Perhaps. What has me worried is that if there is a correction in stock & commodity prices, funds will be selling precious metals to cover their positions. This would lead to alot more 'panic selling', the result of which I think would see gold fall to $US550/oz. Talk about life being a 'tight rope'.

3. Silver prices: I would have thought silver prices would exhibit a close correlation to the gold price, though perhaps silver has lost some of its monetary charm, and is weak because of the weaker outlook for silver industrial consumption, given that a much higher proportion of silver than gold is used by industry. The silver chart looks seriously bad, so I suspect its about to fall back to $8/oz and consolidate around $9/oz.

In conclusion I dont think the Fed would mind a fall off in asset prices just as it has not been too concerned about a rise in asset markets. I just think it wants to ensure a smooth fall so that people can sell out or go broke 'silently', so that consumer demand is not hindered. I think the Fed will fail on this point. I dont think the Fed will lower short term rates in Sept'07, or if they do, they lower it by 0.25% instead of 0.5%. I think they of course want the market to believe they will support the market with an interest rate cut, but I think instead their intent will just be to allow the uncertainty to wash out of the market. I think the other reason for weaker precious metal prices will be a shake out in base metal markets. I can see volatility on the LME and Comex exchange, where funds will be liquidating gold to pay margin calls on other metals, and otherwise just liquidating.
The good news is that gold and silver will recover, but it will present a good buying opportunity. Months ago there was alot of talk about a shake out in the commodity markets, but that fear seems to have been overshadowed by the 'sub-prime scandal'. I think commodity price collapse might be about to occur. So you'd thus have to expct some volatility in the $AUD, $CAN, RSA particularly, but it will be short term price action for gold and silver.
Tuesday, August 21, 2007
Gold & silver performance
Alot of people seem to hold gold and silver in total disdain. I was just reading an article on Yahoo (http://finance.yahoo.com/expert/article/richricher/42433) by Robert Kiyosaki. There are several aspects to these complaints...but I was actually surprised to see that alot of people hate Kiyosaki...you would think they were blaming him for the property collapse, or not warning them. Just shows how much people are living in a totally rationalised dream world. I can't imagine more press on any issue but overheated US property markets for the last 2 years.
Well Kiyosaki's latest posting is his recommendation to buy silver. Critics argued that gold & silver had under-performed against other metals, that precious metals were no longer relevant, that silver was no longer used in film...so his a total idiot. Well first of all, gold has doubled and silver done even better over the last few year despite the popularity of digital cameras.

Well Kiyosaki's latest posting is his recommendation to buy silver. Critics argued that gold & silver had under-performed against other metals, that precious metals were no longer relevant, that silver was no longer used in film...so his a total idiot. Well first of all, gold has doubled and silver done even better over the last few year despite the popularity of digital cameras.

But more important I think for performance junkies is that you dont buy physical metal - you buy stocks. But consider some of the other benefits of metals over other industries...and tell me that it shouldn't be in your portfolio.
1. How many companies allow you to effectively choose which 'factories' (mines) you invest in?
2. How many industries can you get supply cost curves for each producer?
3. How many industries have terminal markets so they can sell everything they produce?
2. How many industries can you get supply cost curves for each producer?
3. How many industries have terminal markets so they can sell everything they produce?
4. How many industries offer producers the opportunity to lock in (hedge) future prices?
5. How many other commodities give you 100%+ price rises?
6. How many other producers give you a total breakdown of mine costs and revenues?
None, except other metals. Not all miners mind you, but those for whom its a selling point, and just as a matter of routine for any company that has to produce a mine feasibility study. It might not be in stock exchange disclosures, so look in the presentations to analysts on their websites.Its true that precious metals have not performed as well as other metals, but consider why:
1. Mining costs have doubled in the last few years - not because of gold & silver mining but because the big iron ore, coal, base metal projects around the world hogged all the geological services and mine consumables, pushing prices up considerably. Well those metals will have softer prices in future because they are demand-based.
1. Mining costs have doubled in the last few years - not because of gold & silver mining but because the big iron ore, coal, base metal projects around the world hogged all the geological services and mine consumables, pushing prices up considerably. Well those metals will have softer prices in future because they are demand-based.
2. Strong currencies have undermined the performance of precious metals more than other metals because their prices have not risen so high. Commodity currencies like Australia, South Africa, Brazil, etc have mostly doubled, so thats had a huge impact.
But thats all history. Any softening in the global economy will undermine demand based commodity prices and the currencies along with them, but precious metals will out-perform. I expect gold and silver will fall too if financial institutions are forced to sell hard assets to cover loosing financial positions, but precious metals have yet to have the final play. They will at least double over coming years, and I think even better. And you will also benefit from weaker commodity currencies, and investing in the growth earnings of miners...just another reason to invest in stocks...not physical metal.


Whilst I like Kiyosaki's recommendation I think the timing is a little wrong. Why? Because I think that precious metals will be sold off along with everything else if their is a rapid collapse in asset markets, so its best to sit on cash until precious metals take some direction - that is they break a previous high or low.
The chart above shows silver holding the $11/oz support, but I think if thre is a sell off of assets then silver will be sold off, so better to wait for support in more certain markets because they fell faster than they climb. I can see silver falling as low as $8/oz. But it will eventually go as high as $50/oz.
Yeh I know ...people have been saying it for 50 years....well its happened already in the 1970s and its been on an uptrend since I researched (with WHI Securities) and recommended all metals in 2001. Since then it has been strong...but it will go for another rally.
Wednesday, August 15, 2007
Relationship between gold, oil & Dow Jones Index
Its interesting to ponder the historical relationships between certain commodities. By looking at such relationships we can often see patterns that we might not otherwise have seen. A great many scientific discoveries were made on the basis of pattern recognition, and all knowledge is based on patterns. In a sense logic comes down to similarities and differences between objects (foundation of perception) and ideas (foundation of conception, clarified by context).
The trick of course is to ensure the relationships we observe describe something in reality and are not some arbitrary construct. The best way to determine that is:


Reading from the chart we can see (in blue) that the gold-oil ratio trades within a certain band. Lookng at the next chart we can see that the gold-oil ratio has changed over time, so there is a cyclical element to the trade, and as it stands we are at the start of a new downtrend in the ratio, which augers for much higher prices in future. It would be interesting to tie these departures from trend to specific times or events.


The trick of course is to ensure the relationships we observe describe something in reality and are not some arbitrary construct. The best way to determine that is:
1. Identifying similar relationships in related variables
2. Identifying patterns over a longer period of time
3. Establishing a hypothesis that describes the events you describe
4. Testing your hypothesis in a different context.
The focus of this topic is the price of gold in terms of $US, oil and the Dow Jones Industrial Average. The benefit of these materials is that they have been traded for a long period of time, so offer a good historical data base. Gold and oil prices are internationally-traded commodities with a high value so we dont need to be concerned by local disparities because of cultural bias or disparities in transportation costs.
Looking at the oil price, we can see that in the last 20 years prices have varied between $10 to $78 per barrel. Thats a fair spread. This is in nominal dollars. If we adjusted for inflation we can expect this spread to be around half. Looking at the chart below, we can see that the oil price reached a peak of $78/barrel in Mar'06, and has just retraced from a 2nd peak in the last 2 weeks. The implication of this is that we are facing 2 outcomes:
1. The oil boom has ended - the chart pattern suggesting a 'double top'. We should be looking to reduce exposure to oil until we get confirmation at the $55/barrel level.
2. The oil boom is continuing - the chart pattern suggests an 'ascending wedge', in which case the oil price could fall back to $55/barrel and find support before recovering.
Clearly we dont need to know anymore until we get to that level since oil prices are going their under either scenario. This is supported by the current tightening in interest rates and possible recession outlook. So when $55/bbl is reached, we should be looking for a new direction. Of course its possible that oil prices could still go higher, in which case we should see oil prices holding the $70/bbl support.

The gold price is at an historically high level in nominal terms but consider that copper prices have rallied from $0.80/lb to $3.50/lb (450%), but gold has only risen from $290 to $720/oz (350%). Considering this and the fact that gold prices are much lower in real terms, perhaps there is more upside to gold. For a number of reasons I think we are looking at a 'super-cycle', where the expansions have been lengthened by market liberalisation and technological innovation. When you consider that Vietnam (75mil), Bangladesh (150mil), Indonesia (230mil) have yet to really open up their economies, there is still alot of cheap labour offering ever-lower unit labour costs. Thus I maintain that there is still alot of market potential, both for opening up new consumer, savings and debt markets. At the end of the day, that's of significance to gold because it results in greater consumption, which erodes the stockpiles retained by central banks. Can we expect gold to break $700/oz again, or are we looking at a fall back to the $500/oz support?

The following chart is an interesting way to look at gold and oil prices. By looking at the price of oil in terms of gold we are stripping out inflation and productivity issues which impact on both. Oil and gold prices have historically had a close relationship. Yet oil is an industrial material, whilst gold has a quasi-monetary value besides. I would suggest that gold follows the industrial supply-demand paradigm in the good times, but functions as a monetary unit when paper (fiat) money is in question, where the threat is inflation. Of course credit expansion can be unwound by cost of living inflation or asset deflation (debt liquidation).


Reading from the chart we can see (in blue) that the gold-oil ratio trades within a certain band. Lookng at the next chart we can see that the gold-oil ratio has changed over time, so there is a cyclical element to the trade, and as it stands we are at the start of a new downtrend in the ratio, which augers for much higher prices in future. It would be interesting to tie these departures from trend to specific times or events.
Yet another ratio we can look at is the Dow-Gold Ratio. This ratio is simply the Dow Jones Industrial Average (DJIA) divided by the gold price in nominal terms. The DJIA represents just 26 stocks on the NYSE, however they embody some of the largest companies in the world, so it is still seen as a good proxy for the US market. The rationale for using it is that it has been measured since 1897.
The chart suggests that the value of equities is growing at a much faster rate than the price of gold, and that there is a linear relationship between these variables. I think the rationale for this relationship is the growing use of credit or more importantly the greater leverage offered by financial institutions. The implication is that a certain amount of that money floods into equities, pushing up prices (equity indices) to an unsustainable level, and then they fall off. As we can see, when the Dow reaches a peak (as it did in Sept'00), gold prices are bottoming.


Investing in precious metals
Interested in gold bullion - see the London Bullion Market Association listings of gold & silver bullion dealers whom buy and sell gold. Website: www.lbma.org.uk/good_delivery_gold.html. Better still, consider buying stocks in gold or silver producers. See my various equity market blogs.
Saturday, August 11, 2007
Commodities - what and how to invest?
Based on my analysis presented in my Market Commentary blog we are looking at 5 or more years of subdued growth and stable asset prices, or a precipitous shakeout of asset market and credit liquidation culminating in a rapid transition to economic growth, though a calamitous shift in wealth from those with asset or liability exposure to those with cash. The question is:
1. Does the Fed have the skills to maintain a flat market for 5 years?
2. Will global markets be exposed to exogenous factors that might impose instability, eg. bird flu?
Does it not strike people that the safe option is to avoid assets. But under this scenario, where do you put your cash?
1. Cash - the problem with cash is that it makes you no money
2. Gold bullion and other precious metals
3. Gold 'derivatives' that offer exposure to the gold market. The problem with financial instruments like these is that you might not be safe from a failure by the counterparty or market maker. Best to avoid these products.
4. Gold stocks offer the best exposure since you dont just have a fixed exposure to the physical metal, but exposure to a growing inventory of metal, as long as the stock is producing or close to production. The benefit of this is that you have the opportunity for the market to price in long term high gold prices and such an extrapolation can blow out your capital gain. There are several things you should look for - unhedged production and the ability to scale up production.
5. Gold exchange traded funds (Gold ETFs) offer 2 types of exposure. Some buy physical metal, others buy stocks. Equity funds can target emerging producers or blue-chip exposure.
1. Does the Fed have the skills to maintain a flat market for 5 years?
2. Will global markets be exposed to exogenous factors that might impose instability, eg. bird flu?
Does it not strike people that the safe option is to avoid assets. But under this scenario, where do you put your cash?
1. Cash - the problem with cash is that it makes you no money
2. Gold bullion and other precious metals
3. Gold 'derivatives' that offer exposure to the gold market. The problem with financial instruments like these is that you might not be safe from a failure by the counterparty or market maker. Best to avoid these products.
4. Gold stocks offer the best exposure since you dont just have a fixed exposure to the physical metal, but exposure to a growing inventory of metal, as long as the stock is producing or close to production. The benefit of this is that you have the opportunity for the market to price in long term high gold prices and such an extrapolation can blow out your capital gain. There are several things you should look for - unhedged production and the ability to scale up production.
5. Gold exchange traded funds (Gold ETFs) offer 2 types of exposure. Some buy physical metal, others buy stocks. Equity funds can target emerging producers or blue-chip exposure.
Sunday, August 05, 2007
How to invest in precious metals
I often give alot of lip-service to metals, so I will discuss here what is the best approach to investing in commodities. My experience relates to metals only, so excuse my narrow focus on this commodity group.
There are several ways to invest in commodities:
1. Futures: This is where we take a leveraged position in a commodity contract at a current forward price for delivery of physical commodity at some future date.
2. Exchange Traded Options (ETOs): These are rights to buy (call options) or sell (put options) in an underlying financially traded commodity at a certain price, with an OPTION to exercise that contract at a future date. You can hold the contract to maturity, or you can trade it in the secondary options market. Either way, you will be looking to retain a premium over the upfront price you paid for the option + the strike price (paid on maturity), so that you can retain a capital gain. The reference price is of course the underlying security - in this case the commodity price.
3. Contracts for difference: There are a number of financial intermediaries offering contracts for difference (CFDs). These market makers are effectively creating a market that mirrors the a primary market where 'physically traded' positions are taken. There are a range of vendors, eg. CMC Plc, Saxobank, HSBC, etc. Many of these companies dont just trade commodities, but forex, equities and indices as well, all on generous leverage.
4. Stocks: There is the opportunity of course to buy stocks in companies that produce metal, or companies with projects that intend to produce metals. Stocks are considered harder because you have to understand the merits of individual stocks, and thats a more laborious proposition. But the implication is that because the 'devil is in the detail', so are the opportunities. Its common to find stocks which are underpriced, particularly at the speculative (small stock) end of the market. Researching on these companies tends to be less well-supported by brokers with the advent of discount, online brokers. The rise of independent research houses however might change that.
5. Company options: In some markets there are listed, often long-dated options in mining companies that present a very attractive exposure to the underlying security. Maturities might be as little as a few months, or as long as 5 years.
6. Exchange Traded Funds: There are exchange-listed funds that invest in commodities, blue chip or more speculative emerging producers. Resource funds tend to invest in stocks with no leverage, however its prudent to determine if your commodity investment fund is using leverage to take positions, and also just how actively they trade positions. Are they passive or active managers? Some combination might be best. A pure trading fund will be more risky. A passive fund would be risky if your timing is wrong and leverage is high.
When you consider investing in these options, you should consider the following:
1. What is your risk-reward ratio? How much are you prepared to risk loosing in order to gain X%.
2. What is your market knowledge?
3. How much leverage exposure is prudent? What is the downside given the highly leveraged economy, quite apart from your own finances.
Other facts to consider:
1. Commodity choices: There are relatively few metals that can actually be traded. Gold, silver, palladium, platinum on the Comex exchange and lead, copper, zinc, aluminium, nickel on the London Metals Exchange (LME). Other metals are not traded in such terminal markets, so you would need to buy stocks to gain exposure to these markets.
2. Trading platforms: Commodities trading has only become popular in recent years, so the market for trading platforms is not well developed.
3. Volatility: Commodity prices can be very volatile markets when they are in-play because the size of these markets is very small compared to the equity & bond markets, particularly since derivative contracts in these markets often carry larger positions than the physical markets that underpin them.
Best market to trade
The best market to trade depends on personal circumstances. If you are accustomed to options or futures trading, you might prefer that, since stocks might exposure you to a range of technical (mining) parameters that you dont understand. Alternatively, you might decide to buy a range of stocks to reduce this risk exposure. Regardless of the market you trade, everything in life carries a risk. If you opt out of life's challenges, you present yourself with a equally daunting financial risk. In conclusion, risk is not avoided, its managed. There is no fixed 'risk exposure'. Risk is a personal factor. You can't say options are risky or not, it depends on your level of preparedness. There is the perception that you are 100% exposed with options, but you retain at least some tangible asset with stocks....but there are always exceptionsd. Big companies are promoted as safer than small companies, but its not always the case. Test those market assumptions that you accept. I've invested in small companies sitting on $5mil in cash but the market places a value of $2-3mil on their listing....which in itself could be worth $3-5mil for a company in a hurry to get listed.
There are several ways to invest in commodities:
1. Futures: This is where we take a leveraged position in a commodity contract at a current forward price for delivery of physical commodity at some future date.
2. Exchange Traded Options (ETOs): These are rights to buy (call options) or sell (put options) in an underlying financially traded commodity at a certain price, with an OPTION to exercise that contract at a future date. You can hold the contract to maturity, or you can trade it in the secondary options market. Either way, you will be looking to retain a premium over the upfront price you paid for the option + the strike price (paid on maturity), so that you can retain a capital gain. The reference price is of course the underlying security - in this case the commodity price.
3. Contracts for difference: There are a number of financial intermediaries offering contracts for difference (CFDs). These market makers are effectively creating a market that mirrors the a primary market where 'physically traded' positions are taken. There are a range of vendors, eg. CMC Plc, Saxobank, HSBC, etc. Many of these companies dont just trade commodities, but forex, equities and indices as well, all on generous leverage.
4. Stocks: There is the opportunity of course to buy stocks in companies that produce metal, or companies with projects that intend to produce metals. Stocks are considered harder because you have to understand the merits of individual stocks, and thats a more laborious proposition. But the implication is that because the 'devil is in the detail', so are the opportunities. Its common to find stocks which are underpriced, particularly at the speculative (small stock) end of the market. Researching on these companies tends to be less well-supported by brokers with the advent of discount, online brokers. The rise of independent research houses however might change that.
5. Company options: In some markets there are listed, often long-dated options in mining companies that present a very attractive exposure to the underlying security. Maturities might be as little as a few months, or as long as 5 years.
6. Exchange Traded Funds: There are exchange-listed funds that invest in commodities, blue chip or more speculative emerging producers. Resource funds tend to invest in stocks with no leverage, however its prudent to determine if your commodity investment fund is using leverage to take positions, and also just how actively they trade positions. Are they passive or active managers? Some combination might be best. A pure trading fund will be more risky. A passive fund would be risky if your timing is wrong and leverage is high.
When you consider investing in these options, you should consider the following:
1. What is your risk-reward ratio? How much are you prepared to risk loosing in order to gain X%.
2. What is your market knowledge?
3. How much leverage exposure is prudent? What is the downside given the highly leveraged economy, quite apart from your own finances.
Other facts to consider:
1. Commodity choices: There are relatively few metals that can actually be traded. Gold, silver, palladium, platinum on the Comex exchange and lead, copper, zinc, aluminium, nickel on the London Metals Exchange (LME). Other metals are not traded in such terminal markets, so you would need to buy stocks to gain exposure to these markets.
2. Trading platforms: Commodities trading has only become popular in recent years, so the market for trading platforms is not well developed.
3. Volatility: Commodity prices can be very volatile markets when they are in-play because the size of these markets is very small compared to the equity & bond markets, particularly since derivative contracts in these markets often carry larger positions than the physical markets that underpin them.
Best market to trade
The best market to trade depends on personal circumstances. If you are accustomed to options or futures trading, you might prefer that, since stocks might exposure you to a range of technical (mining) parameters that you dont understand. Alternatively, you might decide to buy a range of stocks to reduce this risk exposure. Regardless of the market you trade, everything in life carries a risk. If you opt out of life's challenges, you present yourself with a equally daunting financial risk. In conclusion, risk is not avoided, its managed. There is no fixed 'risk exposure'. Risk is a personal factor. You can't say options are risky or not, it depends on your level of preparedness. There is the perception that you are 100% exposed with options, but you retain at least some tangible asset with stocks....but there are always exceptionsd. Big companies are promoted as safer than small companies, but its not always the case. Test those market assumptions that you accept. I've invested in small companies sitting on $5mil in cash but the market places a value of $2-3mil on their listing....which in itself could be worth $3-5mil for a company in a hurry to get listed.
GOLD!!! Why 2007-09 is going to be good.
At a time when most metal prices are falling, you might wonder why I would be advocating gold stocks. Well there are a number of reasons:
1. Gold prices have been bouyant after a long period of consolidation. I suggest its poised for a major move to $1100-1500. Much is made of the relationship betwen the gold price and USD, but the reality is that gold has tangible value in and of itself. It has a relationship with all currencies, not just the USD. The only reason that is not apparent is because gold is quoted in terms of USD. Of course, we have to consider the extect to which gold prices are growing of their own accord, and the extent to which they are growing because of USD weakness/strength. We can see from the following chart that gold is on an upward trend, and we should expect a price surge when the price breaks $US695/oz in coming weeks. The $720-730 price level widll be another resistance level. Once broken we should see alot of upward movement in gold prices.

2. Gold fundamentals look good: Gold prices have not risen as much as other metals since 2001. Jewellery demand has recovered as buyers have adjusted to higher prices (costs). Higher interest rates in alot of countries will be politically unpalatable in alot of countries, so expect our 'independent' central banks to go easy on monetary policy...thats to say they will be lagging so real interest rates should remain low.
3. Inflation is getting worse: Consider the world's 2nd largest miner - Rio Tinto - it just reported that cost increases grew as much as revenues at these times of high commodity prices. The government chooses to focus on wages and the 'manipulated' core CPI as a basis for determining inflation, but they are conspicuously flawed when you consider that they fail to consider the costs of 'actual' living. eg. They exclude rent or property values, they exclude food, energy, because these items are considered too volatile...of course that is true over the short term.
1. Gold prices have been bouyant after a long period of consolidation. I suggest its poised for a major move to $1100-1500. Much is made of the relationship betwen the gold price and USD, but the reality is that gold has tangible value in and of itself. It has a relationship with all currencies, not just the USD. The only reason that is not apparent is because gold is quoted in terms of USD. Of course, we have to consider the extect to which gold prices are growing of their own accord, and the extent to which they are growing because of USD weakness/strength. We can see from the following chart that gold is on an upward trend, and we should expect a price surge when the price breaks $US695/oz in coming weeks. The $720-730 price level widll be another resistance level. Once broken we should see alot of upward movement in gold prices.

2. Gold fundamentals look good: Gold prices have not risen as much as other metals since 2001. Jewellery demand has recovered as buyers have adjusted to higher prices (costs). Higher interest rates in alot of countries will be politically unpalatable in alot of countries, so expect our 'independent' central banks to go easy on monetary policy...thats to say they will be lagging so real interest rates should remain low.
3. Inflation is getting worse: Consider the world's 2nd largest miner - Rio Tinto - it just reported that cost increases grew as much as revenues at these times of high commodity prices. The government chooses to focus on wages and the 'manipulated' core CPI as a basis for determining inflation, but they are conspicuously flawed when you consider that they fail to consider the costs of 'actual' living. eg. They exclude rent or property values, they exclude food, energy, because these items are considered too volatile...of course that is true over the short term.
You might be aware that 'gold bugs' have been advocating gold for a great deal of time. Well its not that they have been wrong, as since 2001 gold has risen from $290 t0 $730/oz before consolidating around $630-680/oz. So they have been wrong of late. The reason for this lies in the role played by gold. Gold fills two functions:
1. Industrial demand: There is a supply and demand for gold in industrial and consumer applications like dentistry, electronics
2. Investment demand: There is a demand by consumers and investment funds which is fairly long term, and recognises both the industrial and speculative demand for gold.
3. Speculative demand: There is a transient demand for gold that that recognises its role as money. When the monetary system comes into question, people want to hold gold because its tangible, unlike the paper offered by governments.
When economies are growing strongly there is a portfolio-weighted investment demand for gold that tends to support the gold market. Gold has also been supported by tight supplies as most central banks have agreed not to sell more than 500 tonnes per annum over 5 year periods. When you have strong economic growth other investment options will out-perform gold. It is not until gold is recognised as a safe-haven that we see gold markets really getting their rightful attention. For that to happen, we are going to see:
1. Tightening of interest rates to the extent that other asset classes (property, equities, bonds) offer a poor investment alternative.
2. Higher inflation: Dont expect inflation to readily show up in wage demands, its more likely to show up in higher commodity prices.
3. Technical signal: Gold prices break their previous resistance and move up to higher levels. This is a conservative strategy to wait for price evidence. We need to look at gold in a number of currencies to look at the real change ib gold prices.
I will update this file with more content in coming weeks!
Saturday, February 18, 2006
Silver Commodities Trading/Investing
I have come to appreciate the benefits of commodities trading or investing. Gone are the days when you would buy physical commodities. Using the CMC Plc trading platform (www.cmcplc.com) is one option, but there are others. eg. Saxobank.
By far the best commodity to trade at the moment is silver, though you can always short the other commodities. The only commodities CMC trade are:
By far the best commodity to trade at the moment is silver, though you can always short the other commodities. The only commodities CMC trade are:
- Spot gold & silver
- Platinum & palladium futures
The strategy is to trade these commodities off a moving average - I use MAV(simple, 40), MAV(exp, 30). When it pulls back to the MAV(40), I am inclined to take a position. I see silver going to $US20/oz.
Thursday, September 22, 2005
Petroleum Market Outlook
The world is currently experiencing an energy shortage. There are several reasons for the shortage:
- Excessive intensity of consumption by the US
- Strong growth by the US, China & India in particular, as well as other emerging markets
- Shortfall of refining capacity
Upstream Sector – Exploration
Contrary to investor perceptions, there is no shortage of oil. For the last 30 years oil reserves have remained between 30-40years of annual consumption, or 1 trillion barrels in absolute terms. The bulk of these reserves lie in the Middle East – Saudi Arabia, Iraq, Kuwait, UAE, etc. For this reason, the OPEC countries are likely to increase their share of production capacity. In addition, there are still a lot of areas which are still eventually virgin exploration targets. These areas include:
- Deep water areas of existing & new basins
- Russia – particularly the Siberian peninsula
- West Africa
- India and the Bay of Bengal (delta)
Downstream Sector – Refining
The reason for high oil prices is not lack of oil, but largely poor planning to ensure adequate refining capacity to get that oil to the market. There are several reasons for this:
- Planning & government licensing, eg. Land availability, government permitting greatly slows down the development of new refineries.
- Capital intensive: Refineries are expensive so industry participants are reluctant to build new capacity
- Diversification of energy products: Governments are demanding that producers improve the environmental rating of their fuels, which results in a broader variety of products. This greater variety complicates the product mix and reduces the flexibility of producers and consumers to purchase from other suppliers, creating bottlenecks. This results in a risk premium being added to product prices.
- Poor returns on investment in the 1990s mean corporations were reluctant to build new capacity. Part of the problem was that corporations were more concerned with complying with meeting environmental compliance measures.
Other Factors
A number of non-market factors also have contributed to the market shortage for oil products:
- Poor strategic planning & cooperation between governments and the private sector
- Excessive reliance on oil for transport by many western countries. Sweden and Japan are 2 countries that have adopted transport systems to reduce oil reliance. The USA, Britain and Australia have overly relied on cars, choosing to underfund rail despite declining domestic oil production.
- Excessive growth in the US and China in particular is creating a pressure no global refining infrastructure. These demands are the result of monetary stimulus.
- Subsidised oil products: A number of countries have subsidised their oil product markets so the market signals are not being communicated to the market. These countries include India, Indonesia and China – whom are among the largest oil consumers.
Energy Market Outlook
The outlook for the energy markets is down for a number of reasons:
- Softer demand: The strong global growth recorded in 2004 was cooled off in 2005, and is likely to fall further in 2006.
- Market pricing: Those countries which are subsidising oil products are likely to remove this support because of a deteriorating in their public finances, as well as pressure from the USA and EU.
- Substitution: There is likely to be some degree of substitution for other forms of energy which will free up capacity.
- Inflation: Higher oil prices will feed through to general price levels, eventually causing higher interest rates, which will reduce demand.
- Investment: Higher oil prices will spark investment in new oil capacity, but that will take time to come on-stream. When it does, there is often over-capacity, particularly as shortages usually arise during periods of excess demand.
- Alternatives: Higher oil prices will encourage development and investment in alternative sources of energy, as well as products that utilise these types of energy. Examples include industrial batteries for energy demand (peak load) management, cars and computers powered by fuel cells.
Its already evident that higher oil prices have forced other energy sources higher. Eg. Uranium prices have risen from $US12/lb to $US28/lb, and coal prices have doubled, so additional capacity will grow in these areas as well. Because much of the global trade has grown due to US consumer largesse, its safe to say that a large over-supply will arise.
The positive aspect of higher oil prices is that you can make money out of it, whether by investing in:
- Petroleum Refiners & other energy processors, producers, explorers equities
- Petroleum & other energy product futures
- Alternative energy exposures, eg. fuel cells, battery suppliers, etc
- Railway locomotive manufacturers
In Australia my favourites are:
- Capathian Resources (CPN): It is developing small oil fields in the Czech Republic. Because these are small, land-based fields they are cheap to develop, but under-valued, since close to infrastructure.
- ZBB Battery Systems (ZBB): They have developed a zinc bromide-based battery to compete with the old, less efficient lead-acid batteries. Higher energy prices should prompt greater use of batteries in those markets still dependent on oil for local power generating capacity. This tends to be markets like China and India which are growing very quickly, but also countries like Venezuela and Saudi Arabia that use their abundant oil to fuel power generation, and thus are paying a significant opportunity cost. The batteries allow companies to buy power at off-peak rates and use it at peak periods, saving during those periods.
Monday, September 19, 2005
Gold - Short term price action

The gold price is rallying on fears of inflation. This is not a surprising development because of the precarious state of the US economy. What are the implications. Looking at the following chart, we might expect several things to happen.
Most people focus on the $US price of gold because gold is denominated in $US. But for people holding non-$US assets, this matters little.
The interesting news is the break-out of gold prices in non-$US terms. The chart above shows gold prices in UK pounds, Euro, and we can see that the gold price has broken up into new highs. Its the same with the Yen and $Australia. The implication is that its no longer just $US currency action, its a rise in the inherent value of gold. Gold is valued when markets are fearful of any of the following:
- War: There is no great threat of war at the moment that threatens the financial system, however the Iraqi war has contributed to the inflationary threat.
- Stability of the financial system: Asset values are very high, and with inflation rising, the threat of higher interest rates poses a great threat to the home affordability of new homeowners. Forced sales under a property crash is likely to send prices plummeting. Inflation is good for property, but only when valuations are reasonable. The other fear is an oil crisis as Iran attempts to pursue a nuclear option.
- Inflation: This spells the erosion of the value of money because governments increase the supply of money relative to the amount of goods produced. Over the last decade, the global money supply has grown much faster than the global economy because of credit growth.
- Yields: With the outlook for higher inflation, the yield on bonds and equities looks shaky. In these circumstances the 'non-yielding' precious metals look attractive. Real interest rates are essentially negative at the moment, so the capital gain on gold is attractive.
- Supply shortage: Too much is made of the supply shortage of gold and the Indian & Chinese demand. These countries are still quite poor and the propensity of its traditional buyers to buy falls at higher prices. Industry nor jewellery will not lead this boom, it will be hedge funds and individual hedging against inflation. There is too much money in the global economy, that will feed into gold & other precious metal markets.
Its apparent from the chart above that the price of gold is heading for $US500/oz, the high posted in 1987. This point will be a major point of resistance, which is unlikely to be broken. We are already at $US466/oz, so we are looking for another 8% move. Interestingly, the outlook for gold in non-US terms is less compelling. We are less likely to see strong gold prices in other currencies, except $A terms as global commodities demand collapses with inflationary (oil) pressures and higher interest rates. Most of the gold price action will relate to a fall in the $US - despite the prospect of higher interest rates in the US. The Fed is still well behind the curve when you consider rising inflationary expectations. In fact there is no way for the US government to avoid inflation. The only corrective action is higher interest rates and credit defaults, which will burst the credit bubble, unwinding credit instruments, and thus reducing the money supply. Household super funds will be the biggest losers.
The question remains - Will the gold price in Euro and Pound terms break out of their long term uptrend? One would think so given that the Euro money supply is currently growing at 4x the growth in the EU economy. That means too much money chasing too few goods - that's inflationary.
The relationship between the $US and the gold price remains. Some analysts assert that the correlation has disappeared, but leveraged institutional investors are merely trading the $US by going long (or short) gold. Because the gold market is a lot smaller than the $US currency market, the gold price is much more volatile. Another reason for the departure of gold prices from $US correlation is that investors are taking positions in the gold market in anticipation of $US exchange rate moves. Short term trading merely obscured the relationship between the $US dollar and gold prices.
There is often the fear that European & US central banks will sell their gold reserves into the boom. The reality is that these sales are likely to be peripheral to the speculative demand. In any case, it does not change the story. There is no where else to place money safely.
In fact buying physical gold is not the best way to get exposure to gold. I would be going for the emerging miners which don't require hedging, and which have resource upside.
Go gold!
Sunday, September 18, 2005
Nickel - a declining story
Nickel has been one of the most actively traded metal commodities because of its volatility and reasonable liquidity. It is a highly cyclical market, largely tied to the demand for stainless steel. Some 80% of nickel is use to produce steel products - with stainless steel being particularly important. Stainless steels are used in the building industry, automobiles, food & beverages and water industries.
Nickel is produced from a number of sources:
Nickel is produced from a number of sources:
- Layered intrusives: When ultramafic layered intrusives (molten rock) is emplaced in the earth's crust and precipitates layers of chemically-distinct minerals, its possible for commercial quantities of nickel to accumulate, perhaps in association with chromite, cobalt, copper of platinoid metals (PGMs).
- Nickel laterites: When layered intrusive complexes are subjected to erosion on the earth's surface, the nickel sulphides are oxidised and re-precipitated sub-surface, forming an enriched layer of 'laterite' that often grades 0.5-2% nickel.
The bulk of nickel is produced in just 5 countries - Russia, South Africa, Australia, New Caledonia and the USA, although the Philippines, Indonesia and other African nations are significant producers. Nickel is not rare, so the focus is on the higher grade deposits that can be competitive at low prices, since nickel processing requires considerable investment to produce a high grade concentrate.
In the 1990s, the nickel market was particularly votaile for a number of reasons. The threat of new 'laterite' supply using new high-temp autoclaves meant prices were expected to fall, but 2 keystone projects in Canada & Australia had major setbacks, which undermined the financing for similar projects. The technology has been proven viable, but the experience did demonstrate the risks of new technology. The theory was proven fine, but it was design issues that undermined the project.
Investing in nickel
There are several ways to invest in nickel:
- London Metals Exchange: You can buy spot or forward nickel contracts on the LME - see www.lme.co.uk.
- Equities: You can buy nickel/cobalt producers on the ASX, JSX, TSX and VSE in all shapes and sizes. The largest nickel producers are Minara Res (MRE.ASX) and Sudbury Mines (TSX). You can also buy equities in stainless steel producers in EU, US and Thailand.
The outlook for nickel
In the short term we are likely to see a fall in nickel prices since the US & Chinese property markets are over-priced, as the Western property bubble comes to a close. The US has trailed other markets, but it is set to fall soon. Auto sales in the US fell 12% in Aug'05, the largest fall since 2001. Nickel prices are however unlikely to fall back to prior lows since there are now considerable cost pressures in mining. eg. Raw materials, labour and oil have risen by 30-50%. Much of the price rise has also been caused by weakness in the $US. Higher interest rates will also end the speculative demand by traders for nickel, unless the $US starts falling again.
Nickel prices can be expected to fall back to a consolidation level - remembering that the commercial building sector is still healthy and Japan might yet stage a modest recovery. In addition, buildings are not likely to cancel mid-construction, so we can expect some residual demand to flow through the market.
Long term the outlook for nickel is very strong - driven by Asian construction - particularly in China, India and Eastern Europe. But today, these are very small markets. In 3-4 years, after capacity has been absorbed, we would again expect western markets to dictate market action.
References- Nickel applications: See http://www.nickelinstitute.org/index.cfm/ci_id/25/la_id/1.htm
Nickel recycling: See http://www.nickelinstitute.org/index.cfm/ci_id/6561/la_id/1.htm. There are strong incentives for recycling nickel, though its applications and chemical stability mean that the product has a long life cycle, thus limiting the available scrap supplies. eg. Buildings last for 50yrs.
Statistics
- Base Metals.com: See www.basemetals.com/img/tabs/ni/ni.gif. News service on nickel and other base metals.
The Nickel Institute: See http://www.nickelinstitute.org/, established to promote new & existing nickel consumption. - London Metals Exchange: They provide statistics on spot & forward nickel prices and stockpiles. See www.lme.co.uk.
- Nickel production: Find some stats??
- Nickel consumption: Find some stats??
- Nickel recycling: Find some stats??
- Stainless steel production: See www.stainlesssteel.com ??
Copper - a declining story
Copper is amongst the most important commodities, and hence one of the most traded commodities. The metal can be traded in several ways:
- London Metals Exchange (LME): They quote spot & forward prices, current inventories.
- Chicago Commodities Exchange (COMEX): They quote spot & forward prices in the US market.
- Equities: There are a range of companies listed on the Australian Stock Exchange (ASX), Toronto Stock Exchange (TSX), Vancouver Stock Exchange (VSX), Johannesbourg Stock Exchange (JSE) and the Alternative Investment Market (AIM in London) for investing in copper equities (ie. production). The impact of exchange rates tends to increase forex gains, but reduce equity price gains.
Copper has a multitude of industrial applications including building, automotive, electrical & electronics, tube & piping, marine applications, machined products, telecommunications. For more details see http://www.copper.org/applications/homepage.html. In the US, the building industry accounts for about 46% of copper demand. Little surprise then that copper prices have rallied whilst the US housing market has boomed. Those homes are also furnished with electrical appliances requiring copper.
Copper production has recently staged a recovery as demand-led price recovery signalled a need for further capacity. Yet looking at http://www.copper.org/resources/market_data/images/c1wrld.gif, its apparent that the supply of new copper has been flat for a number of years. The reason for this is clearly innovation, since global growth was strong throughout the 1990s. In addition, copper stockpiles were high in the early 1990s, but its clear that miniaturisation has reduced demand (see http://www.copper.org/resources/market_data/images/global93-02.gif ). It was in the early 1990s that prices were languishing below $US0.80/lb, well below the current prices of around $US2.00/lb. Partly this rise can be attributed to the weak $US in which commodities are denominated.
Outlook
Despite the subdued demand for copper, producers have largely maintained discipline. Larger companies are prone to finance exploration through the 'explorers' rather than go at it alone, developing their own projects. This synergistic relation worked well at low prices, but with higher prices, 'explorers' are able to finance their own projects, so we can expect market discipline to unravel in future. The amount of new capacity has been limited to date because little money has flowed into resource equities. Regardless, commodity prices were low for so long. In the interim however, we can expect a demand-price slump by virtue of the end to US-Chinese largesse. The mercantilist policies of Asia, combined with the debt-exposure of the western markets will limit consumption for about 4 years. In the interim, the 'savings culture' of Asia is unlikely to see consumption expand greatly to cover the shortfall.
References
For more information on the copper market, follow the following links:
- International Copper Association - see
- Copper Development Association - see http://www.copper.org/
- Base Metals.com - see http://www.basemetals.com/
- London Metals Exchange - see www.lme.co.uk - for copper stop & forward prices, inventories
Copper Statistics
- Global Copper Consumption - chart - see http://www.copper.org/resources/market_data/images/global93-02.gif
- Global Copper Mine Production - see http://www.copper.org/resources/market_data/images/c1wrld.gif
- Impact of emerging technologies on the copper market - see http://www.copper.org/resources/market_data/emerging_technologies.html
Sunday, September 04, 2005
Iron Ore - market Outlook
The iron ore market has been a very profitable division for the major multinationals that dominate the industry in year years. The 5 biggest players below account for about 80% of global supply:
- Rio Tinto (Aust, India?)
- CRVD (Brazil)
- BHP (Aust, Brazil, India)
- Assamang (South Africa, Morroco)
- ?? (forget the French company)
- Magnetite deposits, eg. formed by weathering of iron-rich rocks I think. They are typically higher grade. eg. WA, Brazil
- Magnetite sands, eg. In NZ & Indonesia you get magnetite sands being concentrated along coastlines in ancient & modern deposits.
- Haematite deposits, eg. Primary skarn (metamorphic) deposits associated with intrusive igneous rocks
- Peat bog deposits, eg. Philippines, Indonesia, formed by chemical deposition of iron from iron-rich volcanic brines.
- Titanomagnetite deposits, eg. Africa and WA. These are associated with layered intrusives.
So lets consider some of these prospective projects. Most of them arise because sponsors have managed to get the support of brokers keen to earn commissions. Some of the projects have merit. Most of them justify themselves by reference to an "unquantified" China growth story. Regardless, its always possible to find an opinion which supports your project. Regardless, these are investments you trade. Certainly in the long term China will require alot of iron ore, but make no mistake, it will be found. I guess there will be a surplus of resources in another year, and the consequent surplus will probably take 2-3years to be absorbed by the market. Lets consider all the projects that I'm aware of:
- Aztec Resources (AZR): Developing an old BHP mine in the Pilbara region, WA.
- BHP, Rio expansions: These expansions are in the Pilbara region of WA.
- Hancock Mining: Private company with project in Pilbara, WA. Financed by iron ore mining royalties
- Fortescue Metal (FMG): Listed ASX company developing a Pilbara based mine, using established rail & port.
- Lynas Corp (LYC): Project in the Pilbara area.
- AKD Ltd (AKD): Indonesian peat bog iron deposit
- Aurox Resources (ARX): Aurox Res titanomagnetite deposit in WA.
- Mineral Commodities (MRC): South African titanomagnetite deposit (RSA financed)
- Territory Iron (TEA): Intrusion-related skarn deposits in the Northern Territory, Australia. These were mined by Sumitomo in the 1970s. Close to the new railway.
- Anooraq Resources (ARQ.TSX): Yemen titanomagnetite deposit (Canada financed)
- Indian projects: I am sure there are Indian companies expanding projects to get their hands on foreign exchange.
The Rio & BHP-inspired consolidation of the iron market was intended to deliver premium prices for producers. They have benefited from that strategy for about 10years, but it was never going to last forever. The problem being they are victims of their own success. Higher prices spark new project sponsors. In defence of their strategy, these circumstances arose because of Chinese demand, not over-rationalisation to create tight market conditions.
Of the above companies, Aztec Res at 18c looks like particularly good (technical) buying, and the Aurox Res project in Indonesia is also attractive. Unfortunately I can post charts here.
Subscribe to:
Posts (Atom)
 Global Mining Investing $69.95, 2 Volume e-Book Set.
Author, Andrew Sheldon
Global Mining Investing is a reference eBook to teach investors how to think and act as investors with a underlying theme of managing risk. The book touches on a huge amount of content which heavily relies on knowledge that can only be obtained through experience...The text was engaging, as I knew the valuable outcome was to be a better thinker and investor.
While some books (such as Coulson’s An Insider’s Guide to the Mining Sector) focus on one particular commodity this book (Global Mining Investing) attempts (and does well) to cover all types of mining and commodities.
Global Mining Investing - see store
Japan Foreclosed Property 2015-2016 - Buy this 5th edition report!

You can view foreclosed properties listed for as little as $US10,000 in Japan thanks to depopulation and a culture that is geared towards working for the state. I bought foreclosed properties in Japan and now I reveal all in our expanded 350+page report. The information you need to know, strategies to apply, where to get help, and the tools to use. We even help you avoid the tsunami and nuclear risks since I was a geologist/mining finance analyst in a past life. Check out the "feedback" in our blog for stories of success by customers of our previous reports.
Download Table of Contents here.



 Posts
Posts


![[Most Recent Quotes from www.kitco.com]](https://lh3.googleusercontent.com/blogger_img_proxy/AEn0k_t5-UY3LPZMh_Uk2SXpRAGvZxUO2QcleKeytpWMWsUXS7n7ZvrPhQR9yTe-pORVZPNxTWcEJGChWSD8mhuRvQzMcP8Ne-nZNO174NMR4PYDm1eNv8Eq1VmuPdi8E5FQIrZoig=s0-d)
![[Most Recent Quotes from www.kitco.com]](https://lh3.googleusercontent.com/blogger_img_proxy/AEn0k_tVd29f1L_62w_3Rxqi1oFXdx715SUwXr_nW-4AD7l1rEozu_fomUyiP7R4JOuFbsPu-AUizhr8OFsYnIQnG1A5nN3JxpsXaf0WLmBUgenZ5qlVnf3GfwONniIvVX8yZg0ZrW4R=s0-d)
![[Most Recent Quotes from www.kitco.com]](https://lh3.googleusercontent.com/blogger_img_proxy/AEn0k_vqxoCJehNnz8zVxtgQCKHOqsVfAmAcxDoNuSId1jYy6mIA9_9zaPJUc1Y5Ds-BTQn16nuM3vRuWkffVuiMTz1A9L32Ikxl5HgVpwoSmciljPs794n9NfM-i8P_cXdaW-aN1bdOsV0=s0-d)
![[Most Recent Quotes from www.kitco.com]](https://lh3.googleusercontent.com/blogger_img_proxy/AEn0k_tEZtrq_J1YOg3UEI6Ox6WwUgCQ_4YlLcvQ02xcA7hvn3cMfyBIKNg2kVKzeTzXReBdD_EYVmp3Esngf_apzumbzFfegkN_VSeB8Br3x8hCtD_3I75LOOrdQevVTgr3ICDpEh4S4rWX=s0-d)